I feel I own a small piece of the Narratives for Qlik story, because Narratives makes real certain BI/IT points I’ve promoted for years.
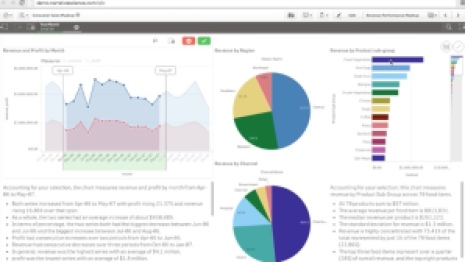
QlikTech is a business intelligence software provider. The story is that an extension from Narrative Science dynamically generates explanatory text that is seamlessly integrated into Qlik Sense data visualizations. Per my quote in the launch press release: Narratives for Qlik – tech that turns your data into a story – is a groundbreaking BI innovation. The ability to provide a new means of communicating insights is really compelling.
What’s unwritten — the rest of the story — concerns Qlik’s distinctive architecture. Qlik isn’t just a visual-BI tool, it’s an extensible data-analysis platform. You can build on it, you being software developers, consultants, and everyday users and not just Qlik staff. And you can distribute your extensions via a marketplace, Qlik Market, that’s open to anyone.
Qlik’s leading visual-BI rival, Tableau, has a support community, and TIBCO Spotfire both hosts a community and provides company-built extensions (here’s an interesting one for Javascript graphics), but neither company supports anything close to the level of open partnership enabled by Qlik’s platform architecture and encouraged by Qlik company culture.
But wait, there’s even more to the story!
Qlik superstar Donald Farmer’s blog article, Off The Charts!, ably makes the case for the Narratives for Qlik ability to provide “a textual interpretation of your visual content.” Donald communicates key advantages provided via added narrative text, but I think I can add a couple that he missed.
Donald writes that “even good visualizations have three important limitations”:
- A need for explanation: “The viewer must understand the visual language in use,” but “not everyone shares [a data analyst’s] insightful reading of even a simple bar chart.”
- “A narrative gloss, describing [nuanced chart] details, can be a handy addition to the visual overview.”
- “Visualizations simply do not tell the whole story in your data. They cannot capture the flow and context of a human conversation which is, in fact, our most fundamental form of collaboration.”
The additional advantages I see — my even more to the story — are captured in two use cases:
- BI accessibility to persons with visual impairments. Standards such as the U.S. government’s Section 508 mandate data-delivery in a form that can, for instance, be read via assistive devices. (For a strong, BI-relevant background, read Stephen Few’s blog article Data Visualization and the Blind.) Most often, this form is a data table, containing row- and column-labeled text. But even easier than that, I’d say, would be a narrative rendering of chart contents, which is exactly what Narratives for Qlik delivers.
- Presentability! Have you ever tried to explain a complex data graphic to an audience? There’s often a lot of pointing and hand-waving involved. You risk bombing if you improvise an explanation on-the-fly, if you don’t study and prepare. But that explanation: It’s precisely what Narratives for Qlik will generate for you automatically. Whether you show the narrative during your presentation or use it in your preparation, I imagine Narratives for Qlik will provide much-appreciated presentability help.
(I have seen suggestions that Tableau visualizations are not Section 508 compliant. At least one company response was evasive.)
Myself, I have long preached IT accessibility — I got a strong dose of the gospel when I helped build the Census Bureau’s first American FactFinder Web site starting in 1998 — as well as the advantages of open platform architectures and the concept of data storytelling. These three elements build out the rest of the Qlik data narratives story.
Disclosure: I consulted to Qlik in the latter half of 2012, into 2013, regarding strategies for bringing text analytics to the Qlik platform.
Are you really endorsing Qlik? Can we not get the same result with Elastic Search? I created the similar graphs in ES & Kibana. I agree Qlik might be easy to use but sharing graphs with client is a bit of pain!!! Demo can be seen on http://www.textminingsolutions.co.uk/insight-dashboard.html
Savitri, thanks for visiting, but did you read my article before commenting? My article is about Narratives for Qlik. So far as I know, Elasticssearch does NOT offer comparable, integrated natural-language generation, via Kibana or any other layering. So no, you can not get the same result with Elasticsearch.